Debugging C++ code
Runtime crash
Runtime crash means that your program may compile and execute, but suddenly stops after a few seconds.Here are a few steps to follow in order to help you find the origin of the bug.
1. Look at the command line
The very first step to do before anything else is to look at the messages written on the command line.Most of the time, the incorrect use of an element of the CGP library will be associated with an error message indicating its cause (ex. index exceeding the size of a buffer, external file not found), and the library may even indicate some hints to solve it.
- - If you run the code from the command line in Linux/Mac, this step is obvious. Make sure you watch the error message from its beginning.
- - With Visual Studio on Windows, the command line may be hidden beside other windows.
-
- > Click on the command line icon to see it before closing the error indication.
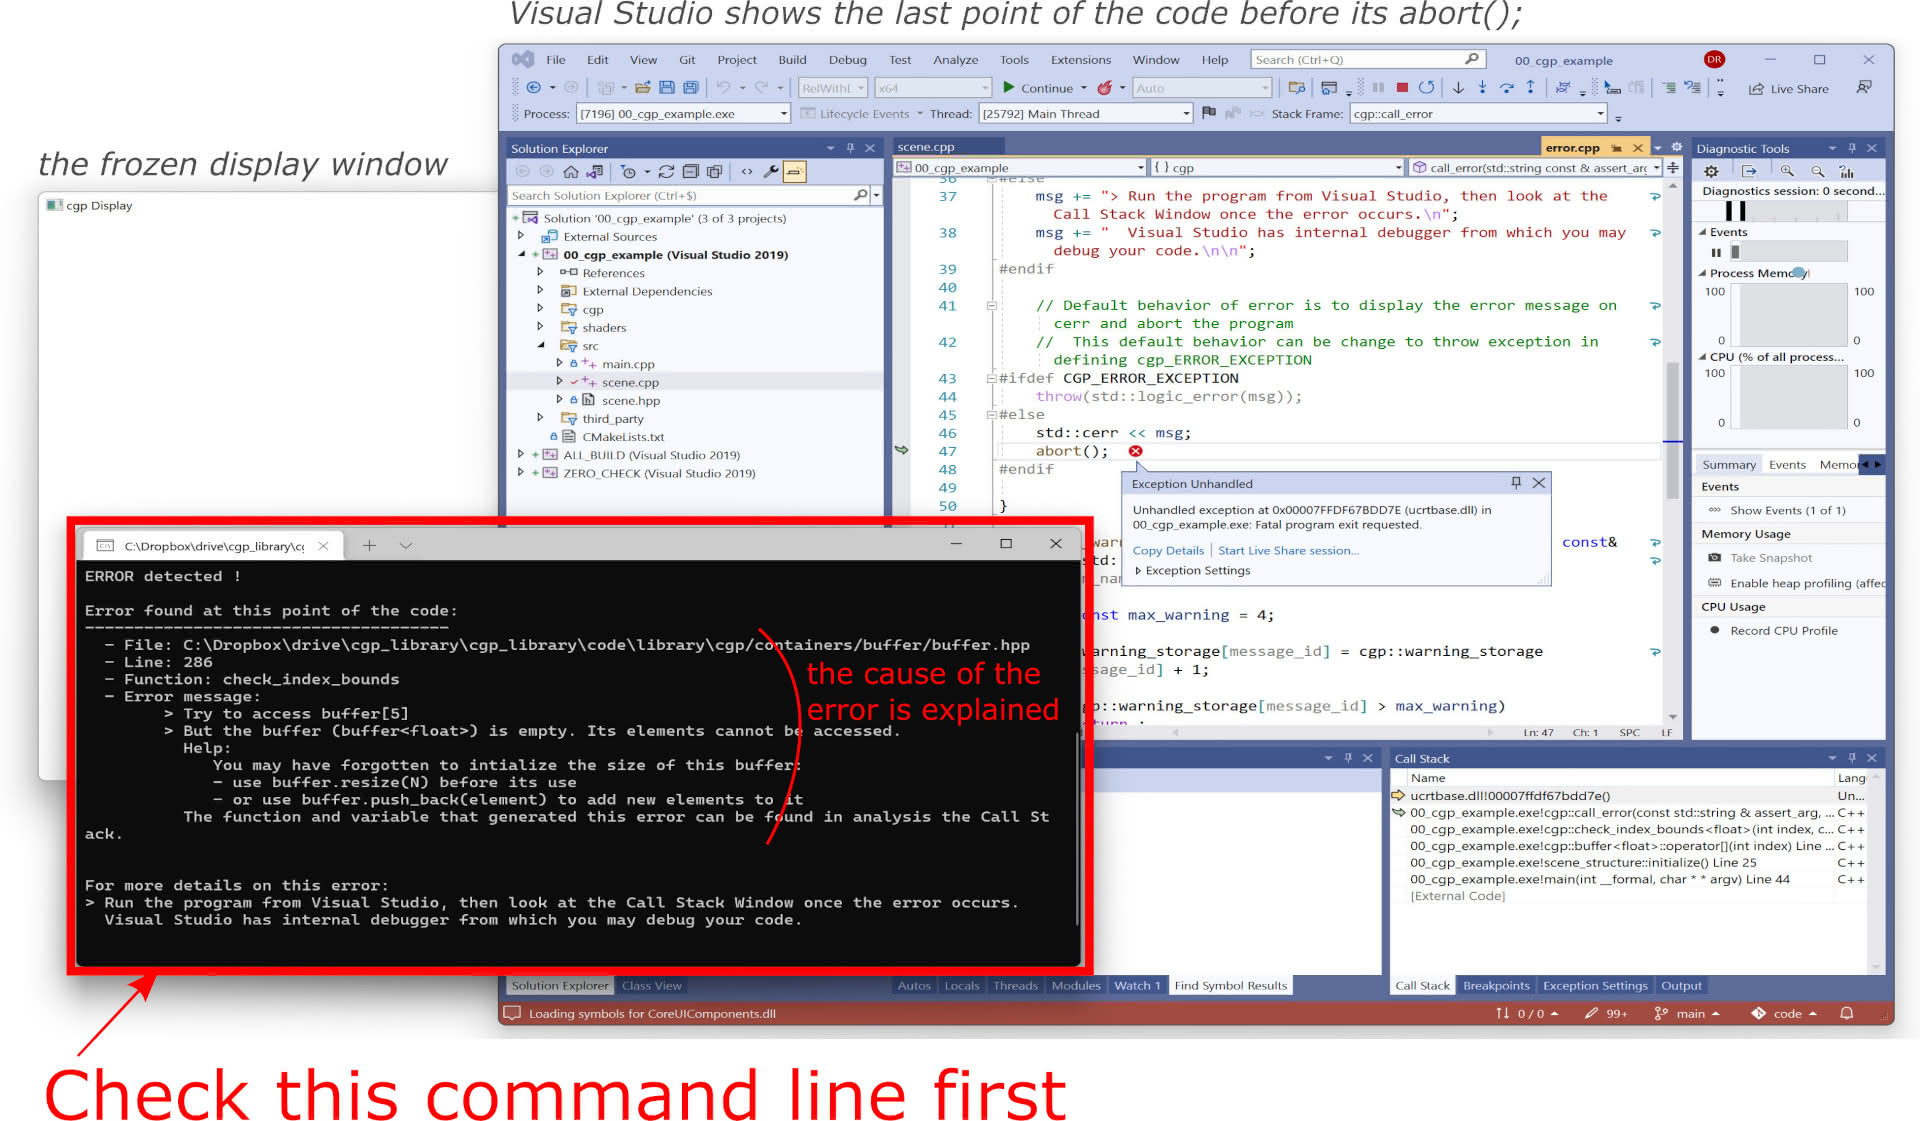
With Visual Studio/Windows, you have to check explicitly the command line, possibly hidden beside other windows.
- - With QtCreator, the command line output is displayed in the software in the tab "Application Output"
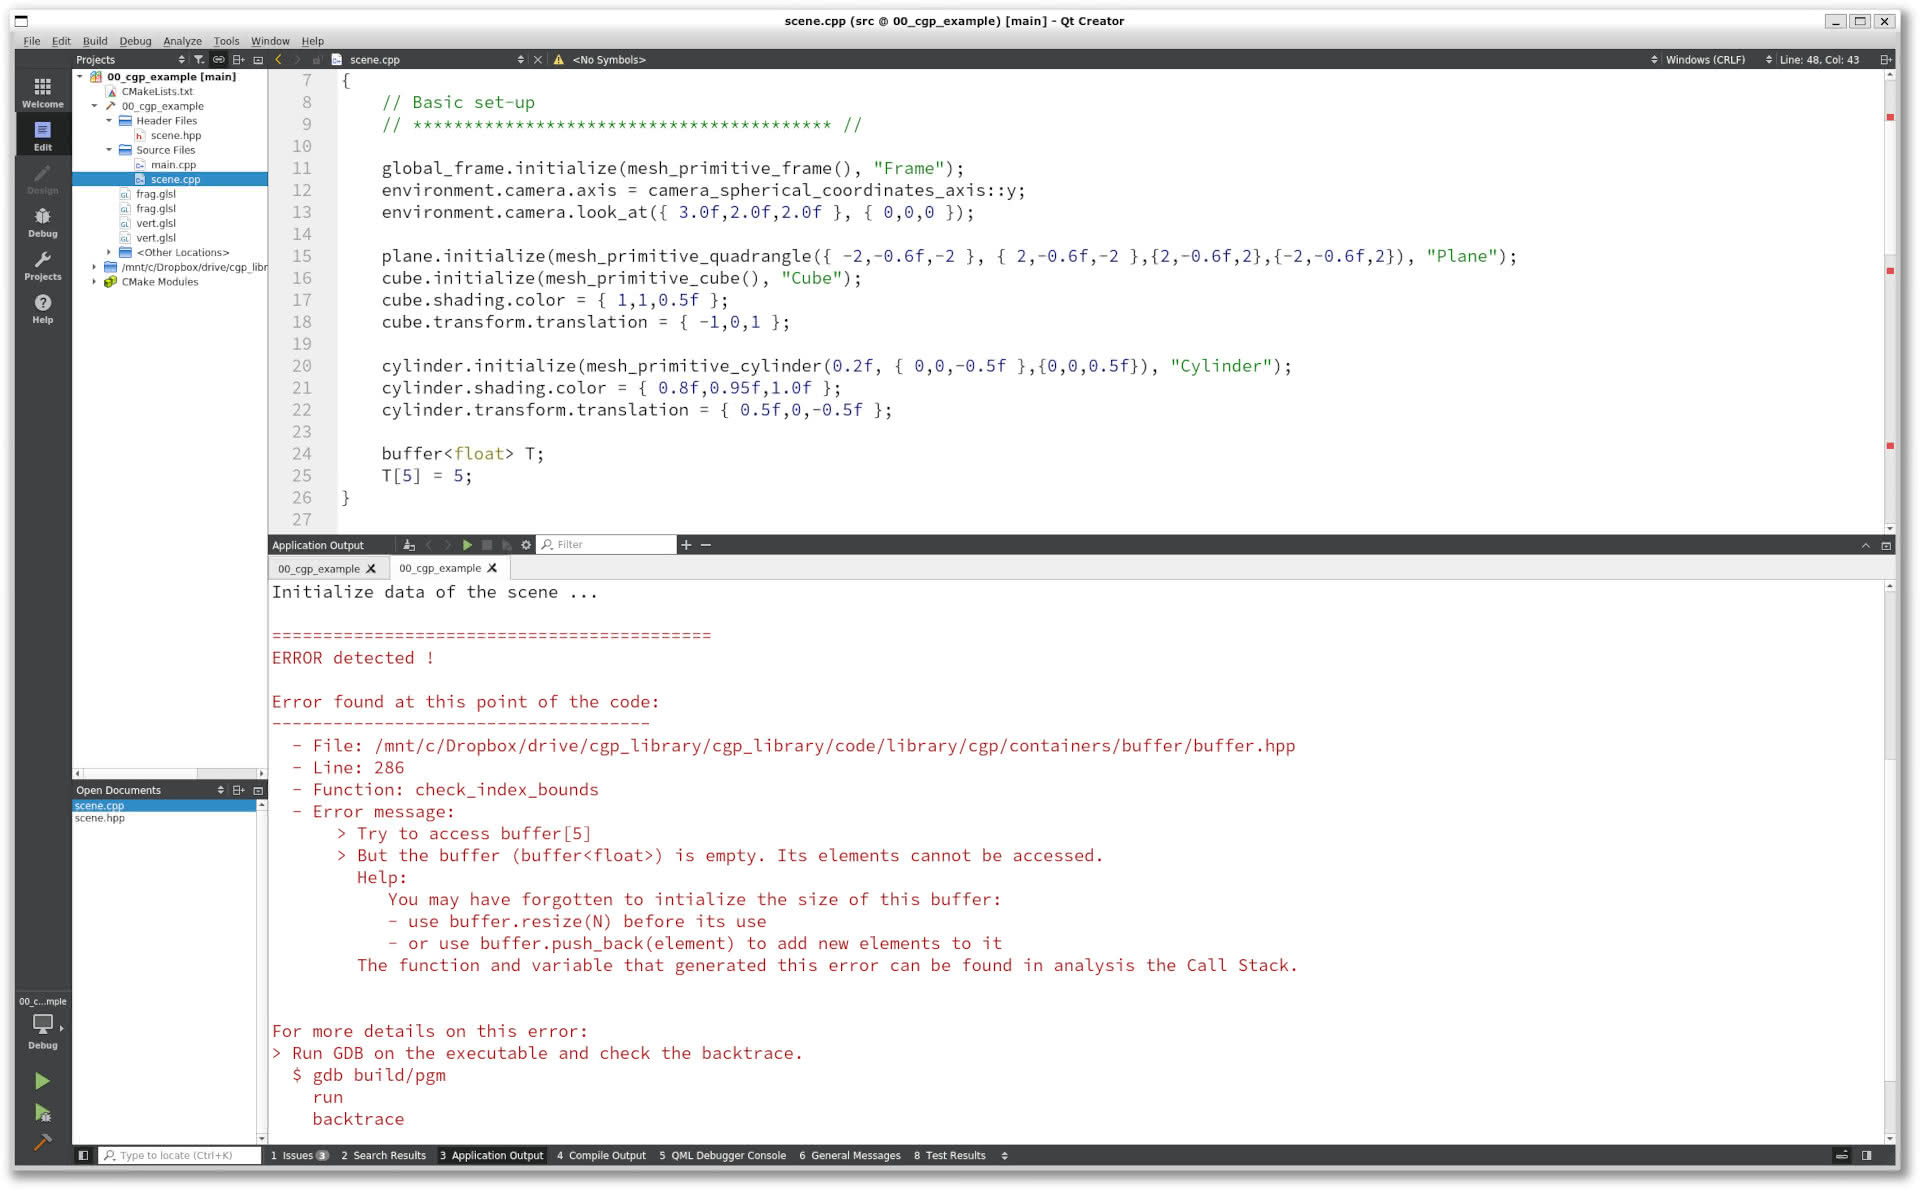
With QtCreator, the output is visible in the "Application Output" tab on the bottom part.
2. Output values
The simplest way to check the value of some of the variables is to display/print their content on the command line usingstd::cout<< yourVariable <<std::endl;
It reaches, however, quickly its limit when the erroneous value is in a long loop, or during the animation loop (too many values will be displayed on screen). The use of call stack + breakpoints can be a more powerful approach. Note:
- - Always add std::endl; (or "\n") after your display. This helps readability, and it flushes the output immediately to make sure that your variable is displayed even if the program crashed after.
- - Adding output in command line in a long loop or in the animation, slows down the program. Make sure you remove them after finding the error.
- - To ease the display of small matrix, you can use the CGP function str_pretty(yourVariable) to display 2D matrices (mat2/3/4).
3. Call Stack trace
It may sometimes be hard to know where the error exactly takes place- ex. you know a buffer index is exceeding its size, but you don't know which buffer and where in the code.
- - Visual Studio automatically displays the "Call Stack" when the program crashes. It shows by default the last file at the end of the stack, but you can move up the hierarchy.
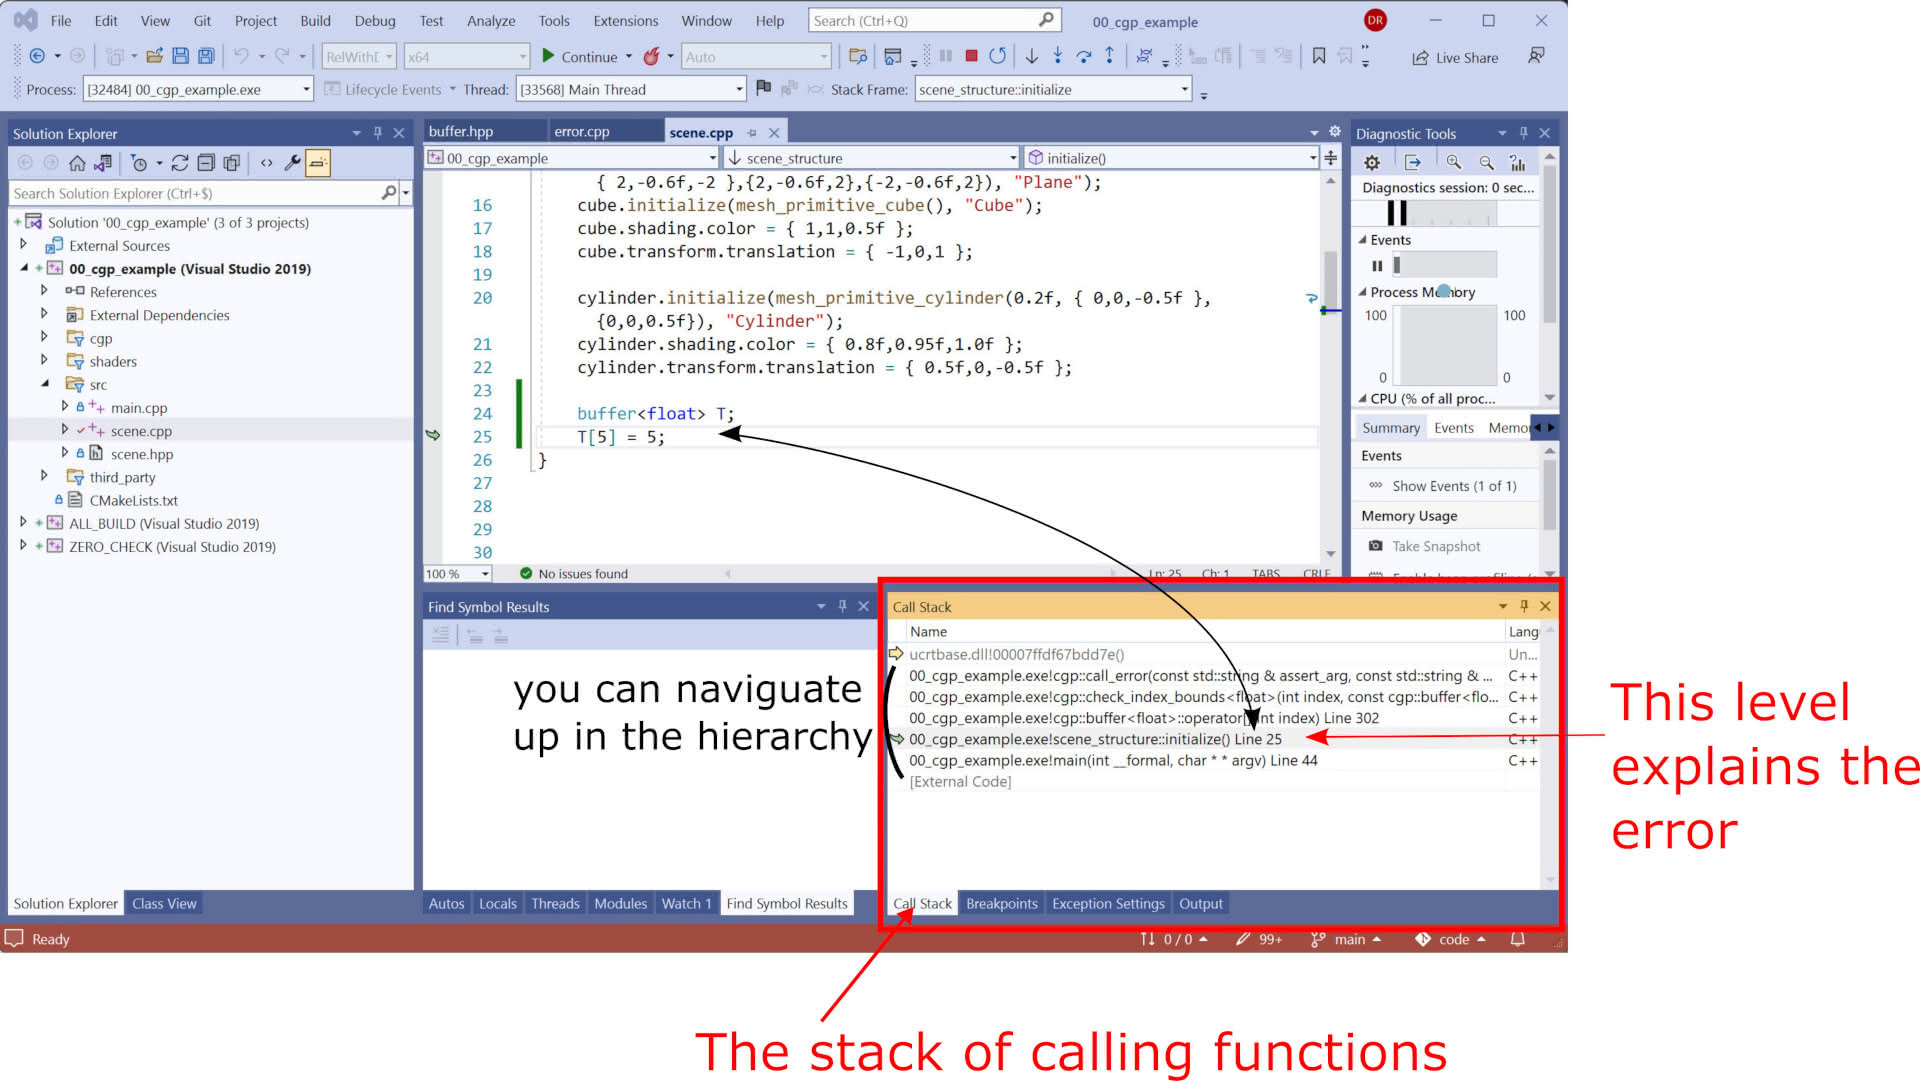
Visual Studio: Interactive navigation in the Call Stack to find the origin of the error.
- - QtCreator also provides an interactive Call Stack. To have access to it, you need to run the program using the "Debug" symbol (or using F5 instead of CTRL+R).
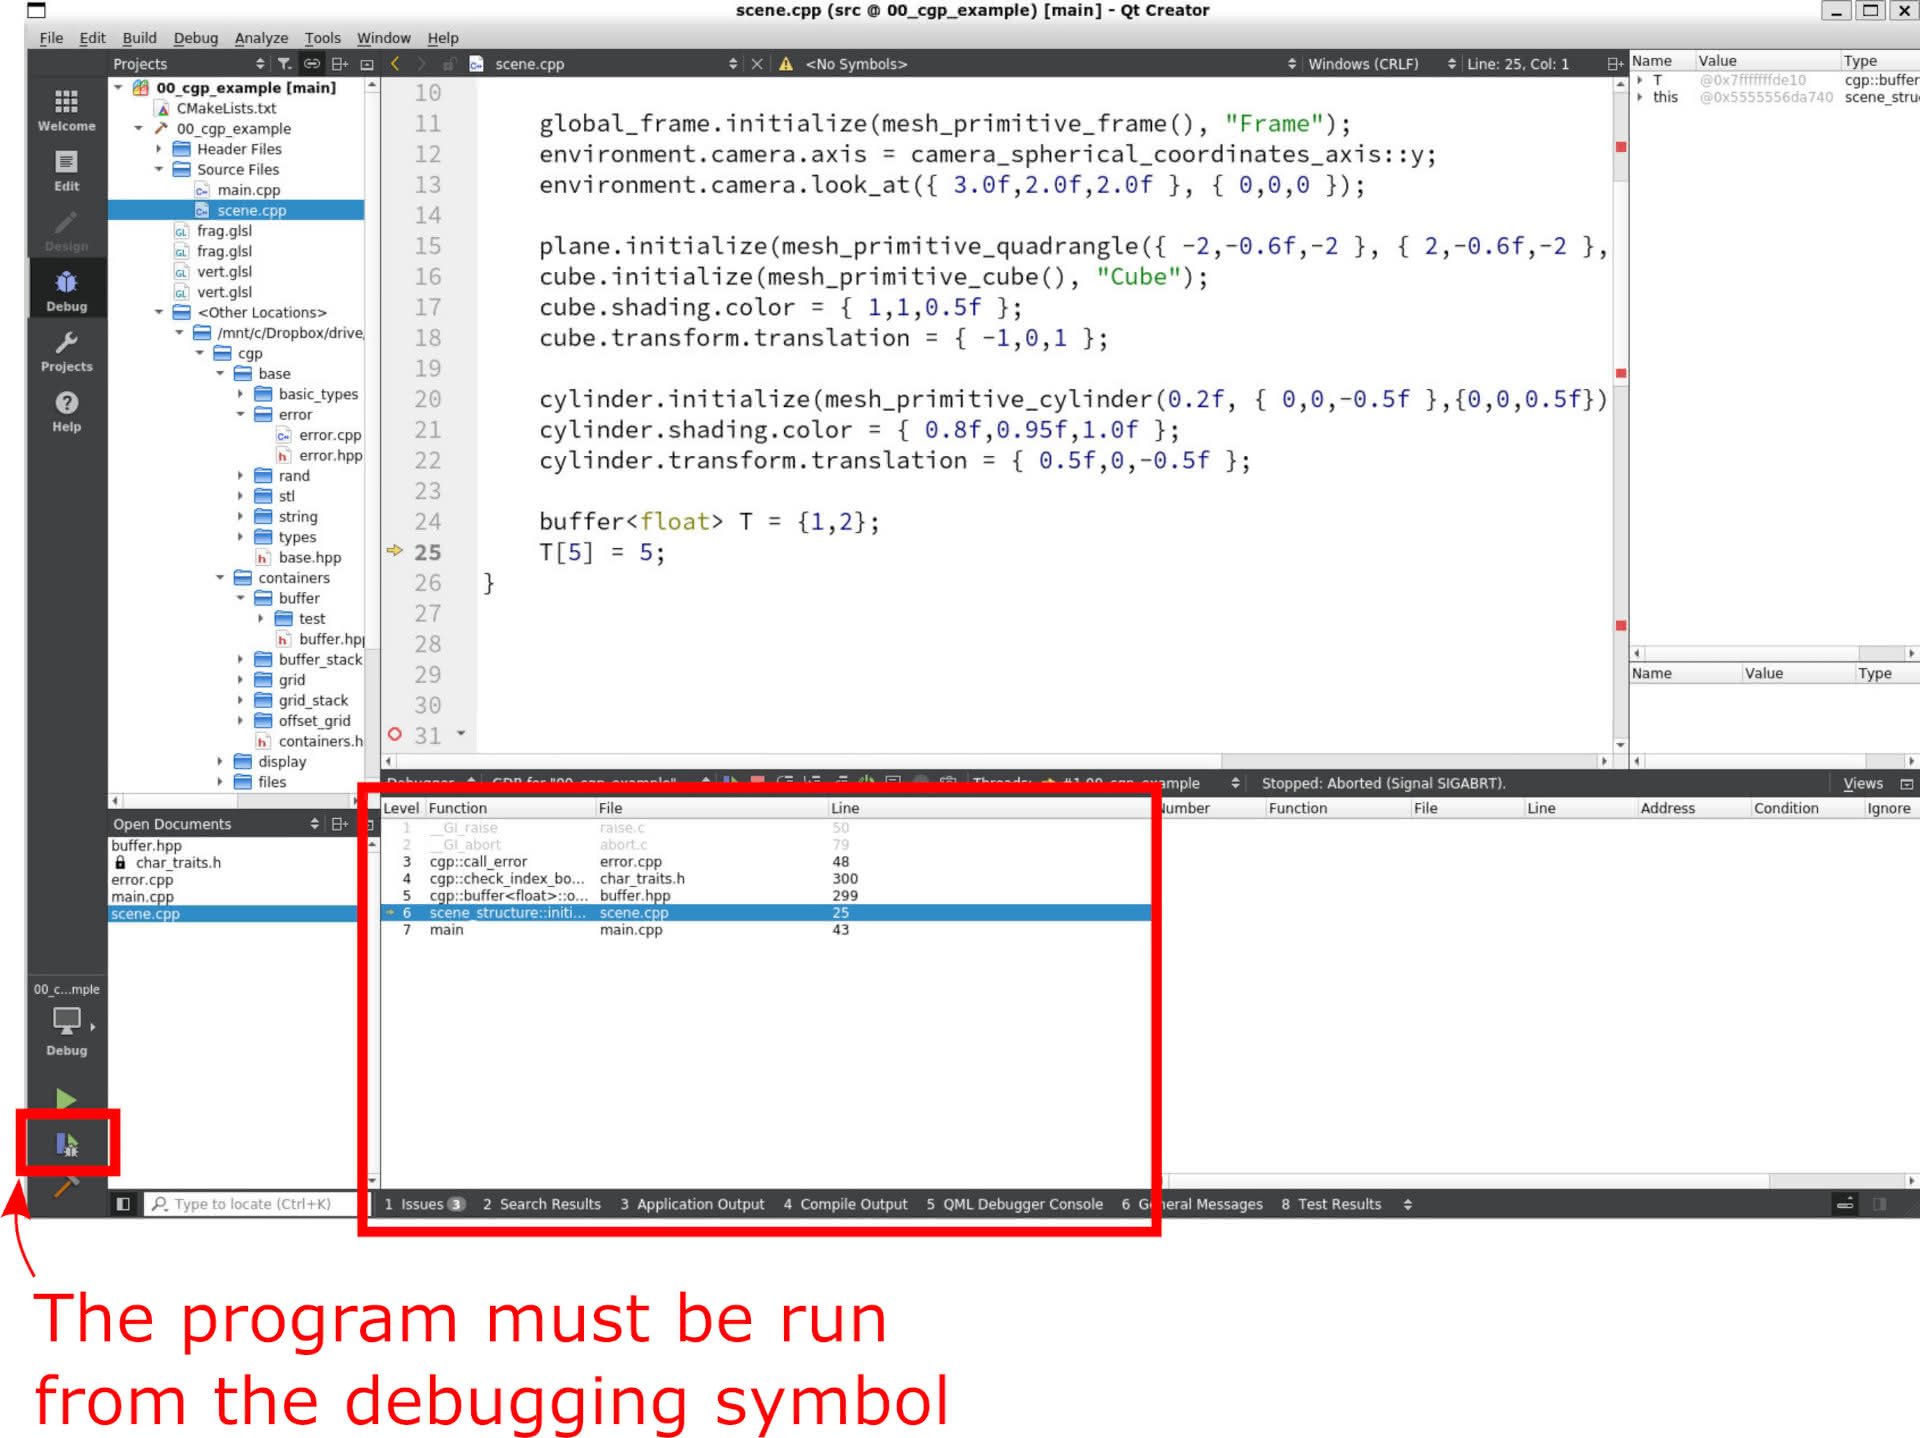
QtCreator: Interactive navigation in the Call Stack to find the origin of the error.
- - In command line the "Call Stack" is less automatic, but can be called from tool gdb.
Type the following commands
# call gdb to your executable (adapt its name to your case)
gdb build/executableName

# Then in GDB interface:
# run the program until it crashes
run

# display the stack of calling functions at the crash position
backtrace
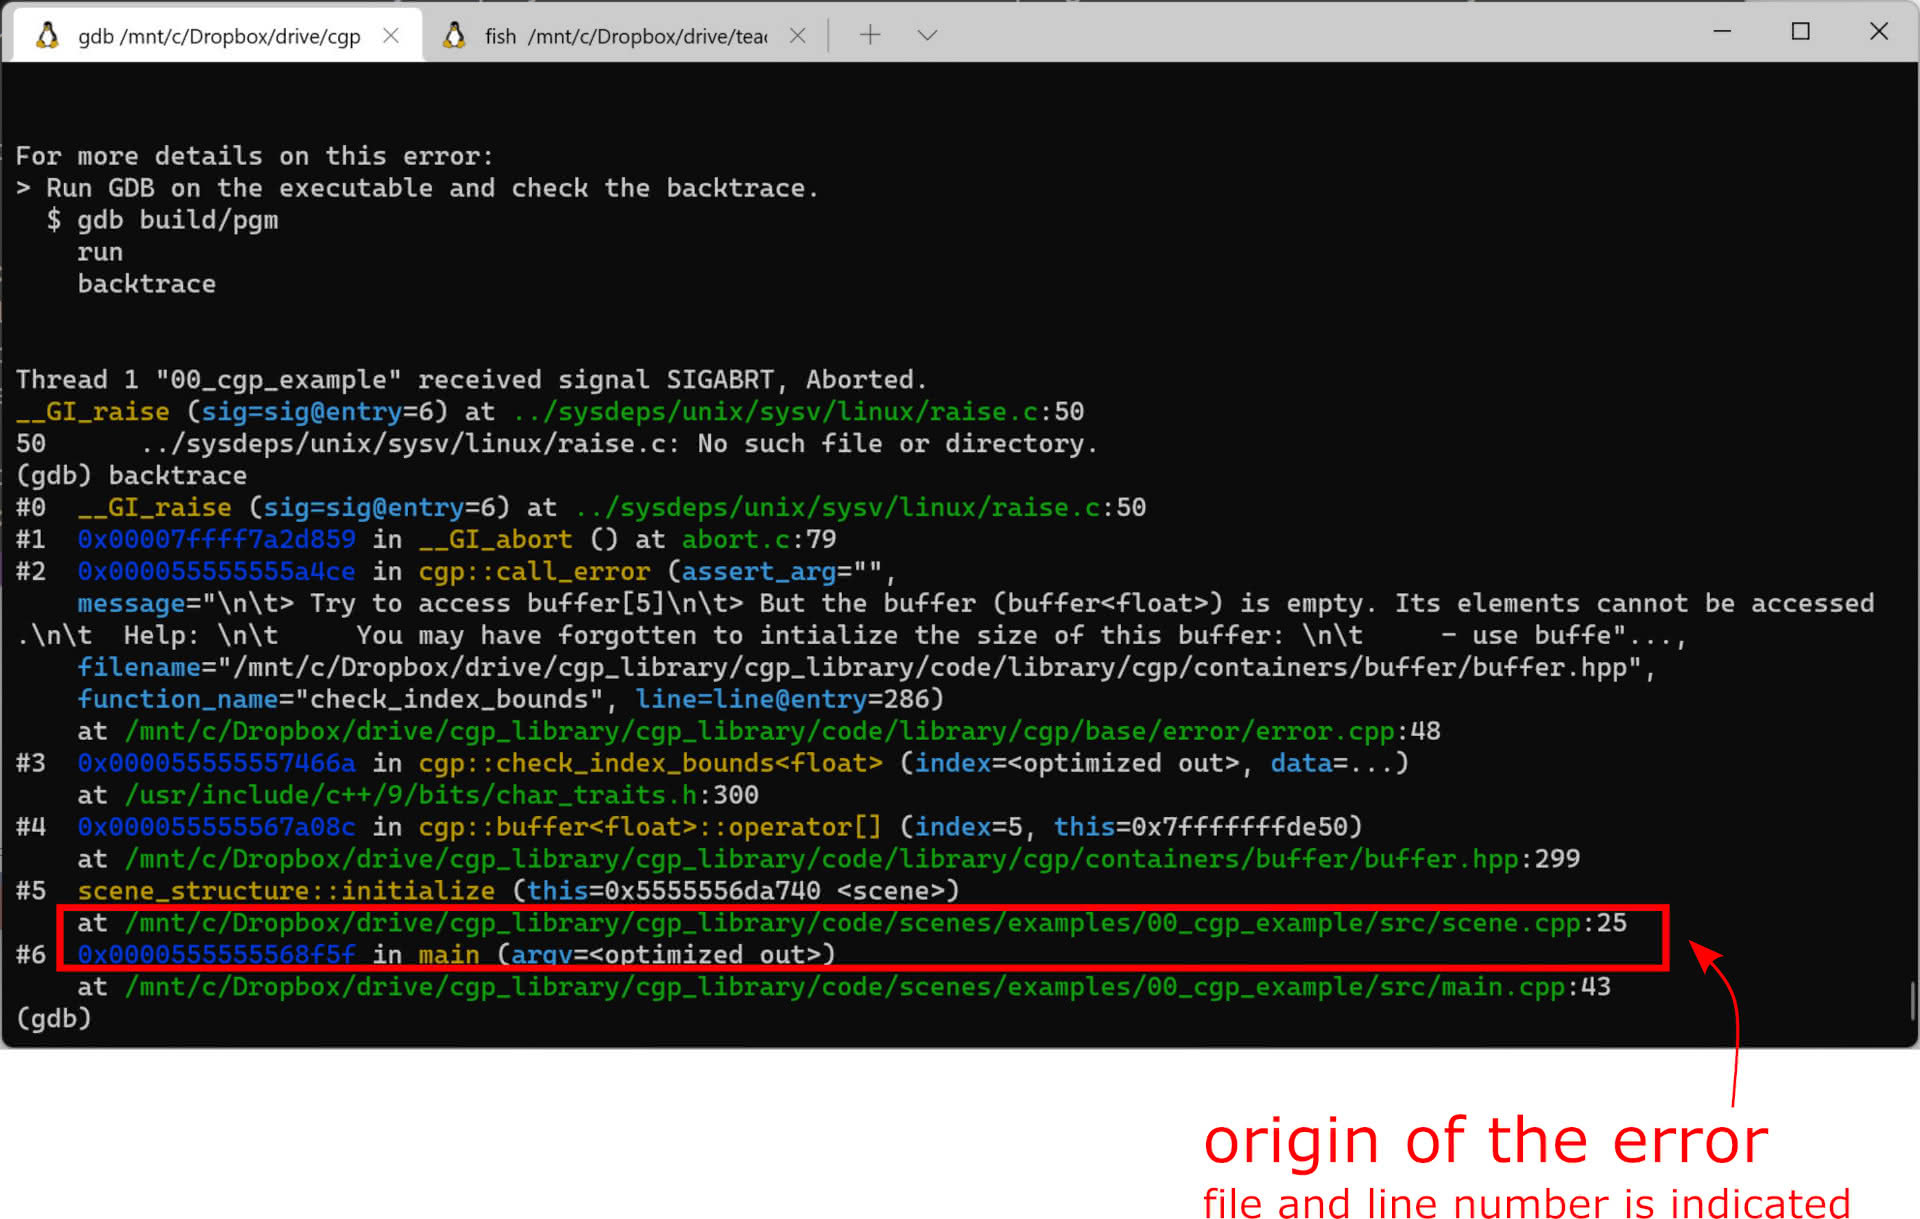
The call stack can be displayed in command line using gdb in Linux/Mac.
4. Break-point
Visual Studio and QtCreator come with a visual debugger enabling you to set break-points in the code.Once run, the program stops at the breakpoint and you can inspect every variable from this point as well as advancing in the program either line-by-line; to enter/leave a function; or to advance up to the next breakpoint.
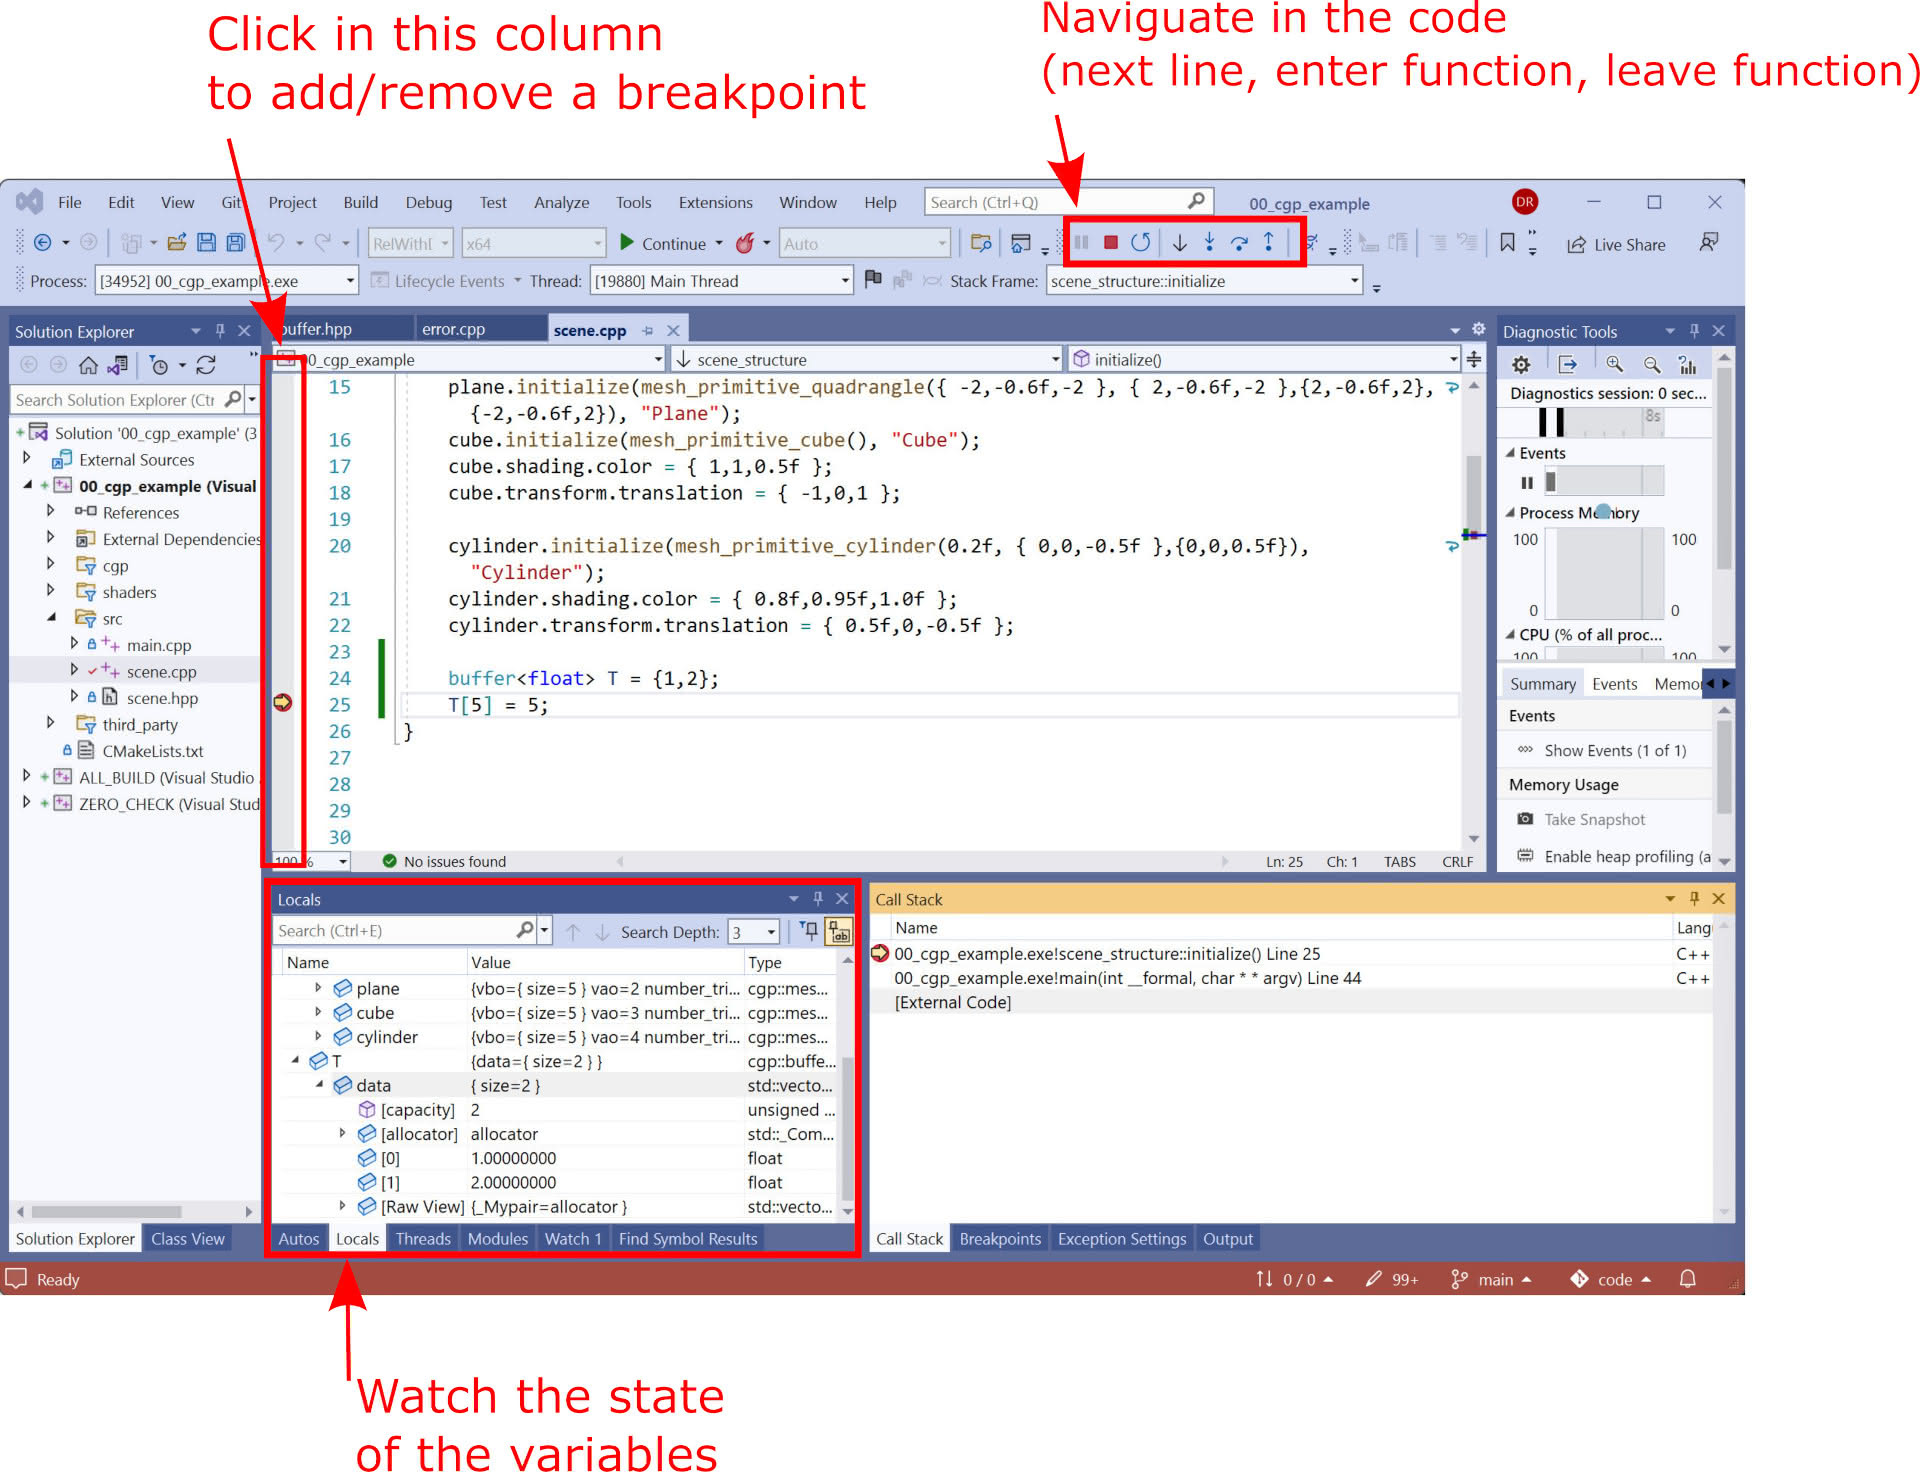
Breakpoint in Visual Studio.
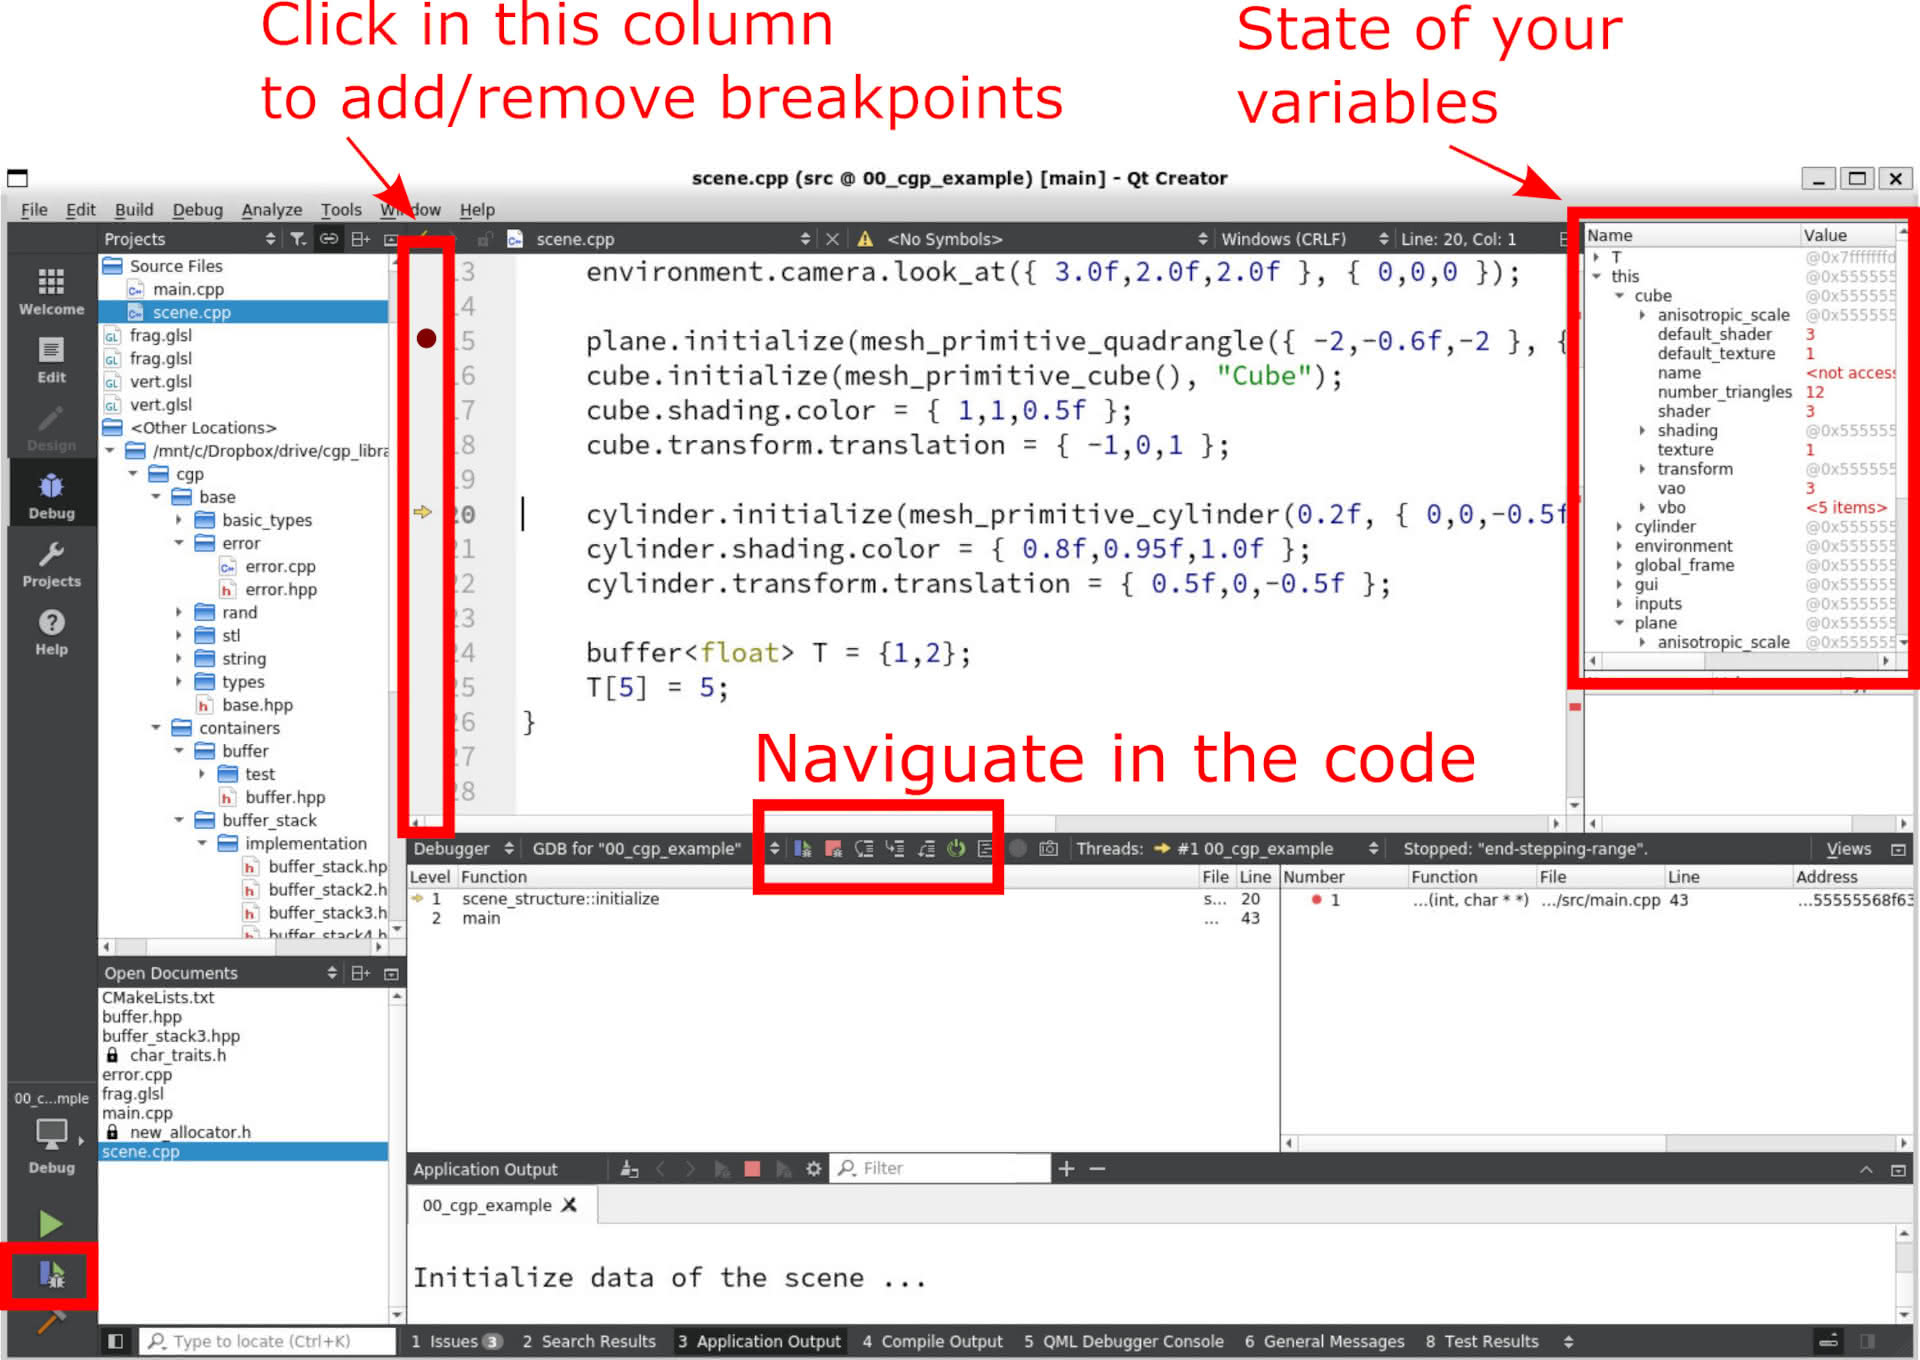
Breakpoint in QtCreator.